
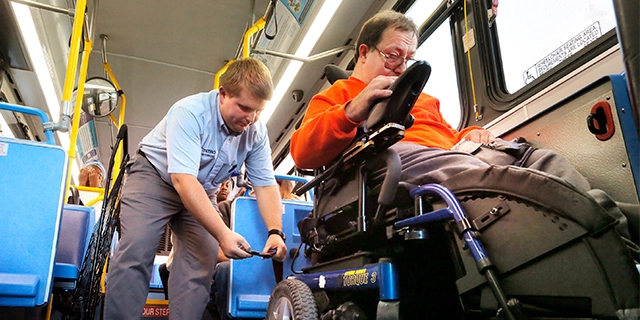
A Metro bus driver fastens a strap to secure a passenger’s wheelchair in Portland, Maine. (Gregory Rec/Portland Press Herald via Getty Images)
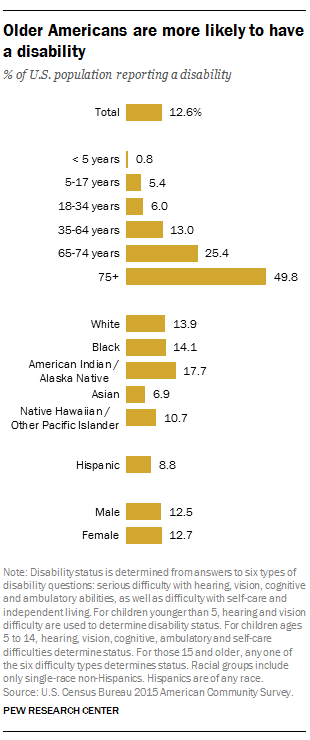
according to the American Community Survey. About half of Americans ages 75 and older (49.8%) reported living with a disability in 2015, as did about a quarter (25.4%) of those 65 to 74. In contrast, just 6% of Americans ages 18 to 34 and 13% of those 35 to 64 said they had a disability. In absolute numbers, however, those ages 35 to 64 accounted for more disabled Americans – nearly 16 million in 2015 – than any other age group.
2 While there is little difference between men and women in the likelihood of having a disability, there are differences by race and ethnicity.
Asians were least likely to say they had a disability (6.9%), followed by Hispanics (8.8%). American Indians or Alaskan Natives, on the other hand, were most likely to report a disability (17.7%). Similar shares of whites (13.9%) and blacks (14.1%) reported living with a disability.
3 The most common types of disability involve difficulties with walking or independent living.
More than 20 million people ages 18 and older reported having serious difficulty walking or climbing stairs in 2015,
representing 7.1% of the civilian non-institutionalized population. Another 14 million people ages 18 and older reported having a difficult time doing errands alone (for example, shopping or visiting a doctor) due to physical, mental or emotional conditions.
About 13 million people reported cognitive difficulties. Around 11 million people in the U.S. reported significant hearing difficulty, while roughly 7 million reported significant difficulty with vision, even when wearing glasses.
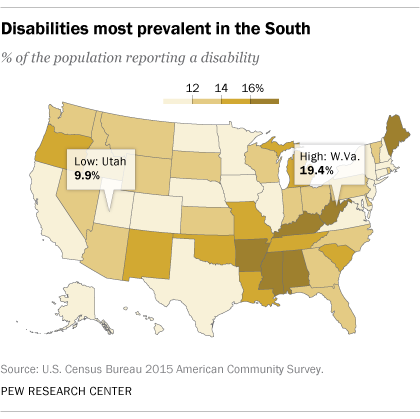
4 Some states, counties and cities are more likely than others to have residents with a disability.
West Virginia had the highest share of any state, at 19.4%. In Arkansas, Kentucky and Alabama, about 17% said they had a disability. In contrast, Utah was among the lowest, with 9.9% of the population reporting a disability in 2015.
Among counties with populations of 65,000 or more, three had shares of a quarter or more reporting a disability: Pike County, Kentucky (28.7%), and Calhoun (25.2%) and Walker (25.1%) counties, both in Alabama. The share with a disability varied widely at the county level, with Kendall County in Illinois (4.9%) among the lowest rates in the country,
nearly 24 percentage points lower than Kentucky’s Pike County.Unlike states and counties, few if any of the cities with the largest shares of disabled residents in 2015 are in the South (among places with a minimum population of 65,000). In Flint, Michigan, Hemet, California, and Pueblo, Colorado, roughly 22% of residents reported having a disability. The town of Fishers, Indiana, had one of the lowest shares in the nation, with 3.5% of residents having a disability – almost 19 points lower than Flint.
5 Disabled Americans earn less than those without a disability. Disabled Americans earn less than those without a disability.
Those with a disability earned a median of $21,572 in 2015, less than 70% of the median earnings for those without a disability ($31,872), according to the Census Bureau. Both figures are for the civilian, non-institutionalized population ages 16 and older, measured in earnings over the past 12 months.
Due to the nature of the surveys associated with this data, certain Americans with disabilities are likely undercounted. The initial recruitment surveys for the American Trends Panel, as well as the phone survey used to determine tech adoption and internet use, were conducted on landlines and cellphones and likely under-covered adults who are deaf or have difficulty speaking. The figures reported on political engagement and voting behavior are from panel surveys conducted via the web and mail, which may underrepresent blind people. In addition, our surveys do not cover those living in institutionalized group quarters, which may include some severely disabled individuals.
6 Disabled Americans were politically engaged in the 2016 presidential election.
In a survey conducted in the early summer of 2016, about seven-in-ten (71%) Americans who self-identified as disabled said it “really matters who wins the election,” compared with 59% of Americans who did not report having a disability. Disabled Americans were also more likely to follow the campaign closely than those without a disability. These findings are from the Center’s American Trends Panel, which found that 22% of American adults self-reported
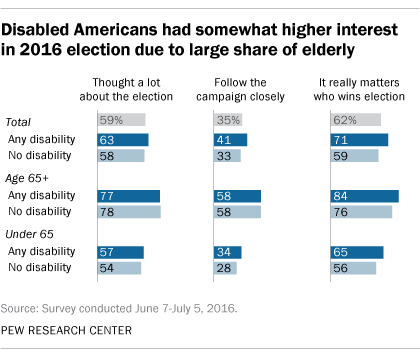
living with a disability in 2016, defined as a “health problem, disability, or handicap currently keeping you from participating fully in work, school, housework, or other activities.”
Disabled Americans were as likely as the non-disabled to say they were registered to vote — and to say they actually did vote— in the 2016 presidential election. In a post-election survey, Americans with disabilities reported vote preferences that were similar to those of voters overall: 46% said they voted for Hillary Clinton and 45% said they voted for Donald Trump.
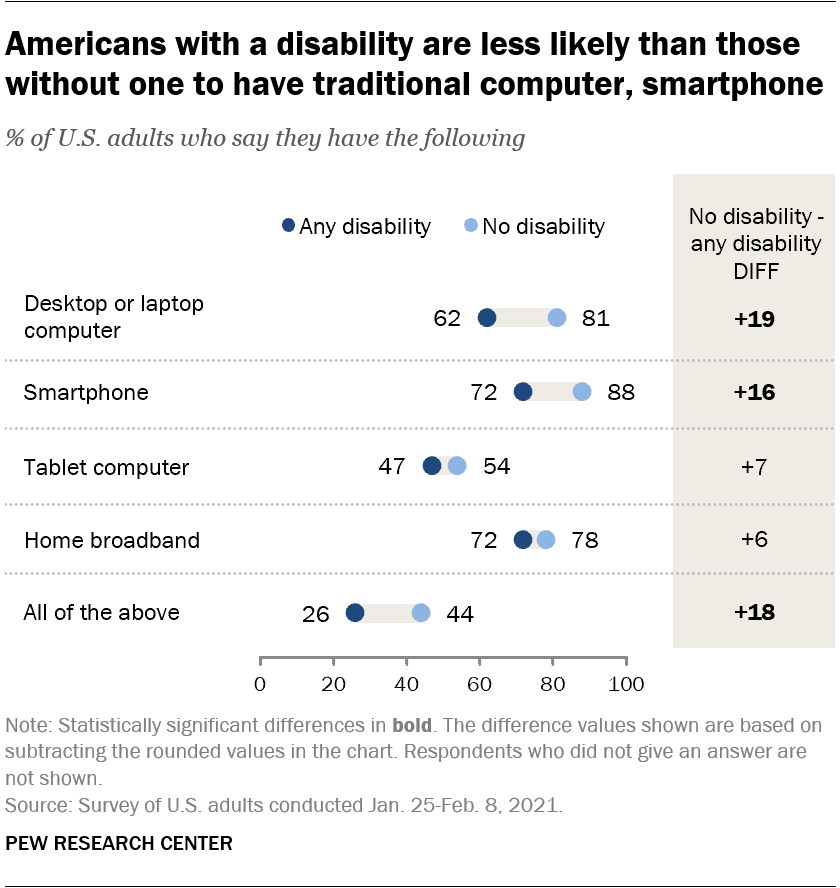
7 Disabled Americans have lower rates of technology adoption.
Nearly a quarter of Americans with a disability (23%) say they never go online, compared with just 8% of those without a disability, according to a Pew Research Center survey conducted in the fall of 2016. Disabled adults are also about 20 percentage points less likely than those without disabilities to say they subscribe to home broadband, or own a traditional computer, smartphone or tablet.
The amount of time people spend online also varies by disability status. Only half of disabled Americans report using the internet on a daily basis, compared to almost eight-in-ten of the non-disabled (79%).
Correction: In an earlier version of this post, the location of the photo was misidentified in the caption. It is Portland, Maine.
Address : 2941 N. 108th ST. Omaha NE 68164.
Phone : 402-972-1382
Open Hours :
Day Center Monday – Friday: 08:00 am – 04:00pm
Art Studio Monday – Sunday : 10:00 am – 06:00pm